Comparisons
of Achievement of “Meeting Grade Level” by Texas Schools—Charter schools and
ISD schools
Charters v ISDs. In this section you can run a program that displays
the degree of success of over 8,000 Texas schools in achieving “Meets Grade
Level” criteria for their students. The MGL success data are for
school year 2021-2022. The principal focus of the displayed data is
upon academic success relative to the proportion of economically disadvantaged
students in each school. The individual school data can be displayed
for all the schools in each county or for all the schools in a district, and
the results can be distinguished between those for charter schools
and for schools included in regular school districts.
The following figure provides one example of how
the version of this software can be used to compare results between charter
schools and regular public schools. The underlying data were obtained from the
Texas Education Agency’s website, and are for school year 2018-2019. Data for
7,671 schools are included—all grade levels, both charters and ISDs.
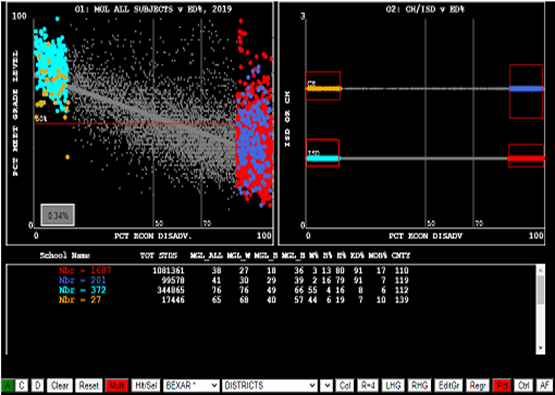
Two comparisons between charters and ISDs are
shown in the figure below, one for high poverty schools, the other for low
poverty schools. The left-hand graph
plots schools on the basis of the percentage of students achieving the “Meets
Grade Level” criteria (vertical axis) for various average levels of student
economic disadvantage (horizontal axis). The graph on the right is a plot of
ISD schools versus percent economic disadvantage on the lower line, and
similarly for charter schools on the upper line. When a number of high poverty
ISD schools were highlighted in the right hand graph, the same schools were
highlighted in the graph on the left, and average values of various data
elements were written beneath the graphs. Then, when a group of charter schools
in the same poverty range were highlighted on the upper line in the right hand
graph, the same schools were also highlighted in the left hand graph, and the
average values of the same variables written in the second line of date. The
various data elements can be compared as between ISD schools and charter
schools. In the example depicted in this illustration, sets of schools were
also selected for both charters and ISDs at the extreme low levels of average
economic disadvantage. The resulting data for these trials are shown in lines 3
and 4 in the data table. These results, and many more, can be generated using
the software executed by clicking on Item 2: Show ISD-CH Comparisons, at
the left of your screen.
Though the previous discussion
described how to compare MGL results for charter schools and ISD schools, the
graph shown above itself, perhaps, raises a much more profound point: there is a strong, inescapable negative
relationship between the percentages of economically disadvantaged students and
the average rate of those students meeting grade level criteria. Some observers
look at the above left hand graph and see many high poverty schools that are
performing as well as most low poverty schools. Such observations have been
used to make the argument that many high poverty schools with high performance
show what is possible, and what is possible within existing financial
constraints. If they can do it, others
can also, they argued. That, indeed, is
indicative of some of the rhetoric that previously accompanied the No Child
Left Behind program. The testing regime
that was part of NCLB did, indeed, make clear that many children were being
left behind. But NCLB was instituted 20
years ago, and look at the results shown in the graph above. The
performance-poverty line is still steeply negative. After NCLB the school choice movement gained
momentum, resulting in rapid growth in charter school enrollment, including
here in Texas. There are 280,000 charter
school students included in the 553 charter schools plotted in the above figure. But, as you will see if you explore these
data with the included software, the relationship between poverty and school
performance is virtually indistinguishable as between charter schools and ISD
schools. Maybe, just maybe, the effects
of poverty on students’ education cannot be effectively overcome until poverty
itself is reduced. While it might be possible to alleviate the negative effects
of poverty on education in part by providing excellent teachers to all
students, the best programs to all, expanding social services and early education,
these cannot be significantly expanded and upgraded without additional
resources. To those who say that throwing money at the schools will solve
nothing, one might ask why is it that affluent parents of children born into
the most advantageous circumstances are willing to spend upwards of $50,000 per
year for tuition at excellent K-12 schools? If money doesn’t matter, are those
parents stupid?
The brief instructions contained in Items 3
through 6 should enable viewers to begin interacting with the graphs and data
to explore these or other questions on their own.
Note that the two buttons beneath the data
area—LHG and RHG—permit putting different graph layouts into each picture area.
These and other options are described more fully in the Instructions and
Examples that are linked to beneath the data table in the graphics page.
There is one additional feature added to the
ISDCH version of this software, linked to on the left, which is not described
in the Instructions, namely the ability to highlight or select all of the
schools in a particular county. The
county-selection list will appear after clicking (LMB) on the white box labeled
“County” near the bottom of the screen.
If the [Hlt/Sel] button is “On” (red) when this selection is made, the
schools contained in the selected county will in fact be selected. Only those schools will be plotted, and they
can be further queried with mouse action by creating a rectangle around one or
more points (click, move mouse, click again).
On the other hand, if the [Hlt/Sel] button is “Off” (white) when a
county is selected the schools in the selected county will merely be
highlighted, colored by district.
Questions and feedback are welcomed. I can be reached at ltoenjes@aol.com .
Larry Toenjes
Clear Lake Shores, TX