Texas Charter School Funding Inflated by Overly Generous Adjusted Allotment
Laurence A. Toenjes
There is no $1000 charter school funding gap, as charter proponents allege. In fact, charters receive approximately $700 more per pupil for operations than do regular school districts. The charter case rests upon the distorting effects of using a statewide average adjusted allotment. The inflated adjusted allotment results in too much operations revenue and inflated values for WADA. The latter distorts comparisons made on a weighted student bases.
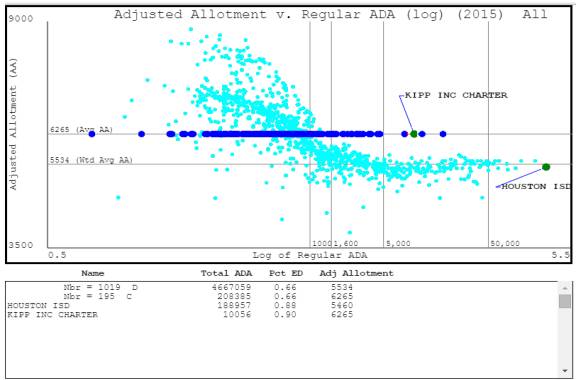
First, some understanding of the following chart is essential. It is extremely informative to actually see the large range in ISD adjusted allotments (aqua) that are averaged together to get the single mean value that is used for all Charters. The facts that the largest values of these AAs are concentrated in the small districts, and that all of those above the average line of 6265 only enroll about 4 percent of all students in the ISDs are very significant. The AAs for charters are plotted in blue in the chart.
Second, the weighted average of the ISDs’ adjusted allotments—$5534—is an important concept. It calculates the average by taking into account the numbers of students in each district. Otherwise Houston ISD with 188 thousand students only influences the average to the same extent as does San Vicente ISD with just 20 students! Currently, TEA does apply a simple arithmetic average, which yields the $6265 figure used in the formula.
Figure 1
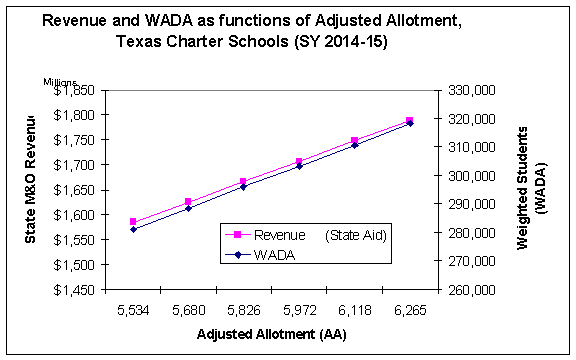
State aid and WADA numbers for each Charter were calculated individually for school year 2014-2015. These calculations result in total statue aid to the Charters of $1,789.7 million. The Summary of Finances report of TEA for Feb. 10, 2015 showed Total FSP/ASF STATE AID of $1,789.7 million, exactly the same, to the nearest tenth of a million. My WADA number was 318,153. The same SOF report showed 318,155. My calculations are obviously extremely close to those in the SOF report that used the same data.
A series of calculations for the Charters were then carried out that varied only in the value used for the adjusted allotment. As can be seen in the following table six runs were made, with the AA going from 5,534 to 6,265. In other words, they began with the weighted average AA and ended up with the arithmetic average. For each AA the following table displays the amount of calculated state aid going to the Charters, and the calculated WADA. The Refined ADA, also called total ADA, did not change. For each level of AA the Revenue per ADA and Revenue per WADA were calculated. Also shown is the ratio of WADA/ADA. (The WADA/ADA ratio for all ISDs is 1.34)
Table 1
|
Adjusted
Allotment |
Revenue (State Aid) |
WADA |
Refined ADA |
Revenue per ADA |
Revenue per WADA |
Ratio WADA/ADA |
|
|
|
|
|
|
|
|
|
5,534 |
1,584,872,149 |
281,031 |
208,385 |
7,606 |
5,639 |
1.35 |
|
5,680 |
1,625,791,621 |
288,445 |
208,385 |
7,802 |
5,636 |
1.38 |
|
5,826 |
1,666,711,093 |
295,859 |
208,385 |
7,998 |
5,633 |
1.42 |
|
5,972 |
1,707,630,565 |
303,273 |
208,385 |
8,195 |
5,631 |
1.46 |
|
6,118 |
1,748,550,037 |
310,688 |
208,385 |
8,391 |
5,628 |
1.49 |
|
6,265 |
1,789,749,780 |
318,153 |
208,385 |
8,589 |
5,625 |
1.53 |
It is obvious that as the AA increases so, too, do total state aid and WADA. The increases in the AA cause parallel increases in both. However, state aid increases by 12.9 percent, whereas WADA increases by 13.2 percent.
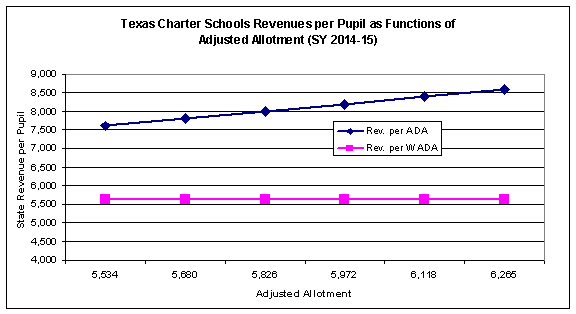
The result is that while Charter revenue per ADA increases from 7,606 to 8,589 Charter revenue per WADA does not increase. In fact, it decreases slightly, from 5,639 to 5,625. The result is that when state aid to Charters is increased by $205 million the “preferred” measure of revenue per pupil for Charters—revenue per WADA--actually decreases!
The next table compares ISD revenues per pupil to those for the Charters, which were calculated at the six different values of the AA assigned to them. These comparisons do not include any funds to ISDs for facilities, only M&O funds. On an ADA basis there is indeed a Charter gap when the AA is at the lowest level. The gap there is 264. But as the AA increases the gap become a surplus. At the AA level of 6265, actually used by TEA in SY 2014-15, there is a Charter M&O surplus of 719.
However, when the comparison is made using WADA as the divisor, the Charter gap begins at 239 with an AA of 5,534 and increases to 253 when the AA is set to 6,265.
It is emphasized that the only change made when performing the various calculations was the value of the AA assigned to Charters. There were no changes in the number of economically disadvantaged students, the number of special education students, or any other factor. The only change was the value of the AA.
Table 2
|
Adjusted
Allotment |
Public School Districts M&O Revenues per ADA |
Public School Districts M&O Revenues per WADA |
Charters M&O Revenues per ADA |
Charters M&O Revenues per WADA |
Charter Gap (on ADA basis) |
Charter Gap (on WADA basis) |
|
|
|
|
|
|
|
|
|
5,534 |
7,870 |
5,878 |
7,606 |
5,639 |
-264 |
-239 |
|
5,680 |
7,870 |
5,878 |
7,802 |
5,636 |
-68 |
-242 |
|
5,826 |
7,870 |
5,878 |
7,998 |
5,633 |
128 |
-245 |
|
5,972 |
7,870 |
5,878 |
8,195 |
5,631 |
325 |
-247 |
|
6,118 |
7,870 |
5,878 |
8,391 |
5,628 |
521 |
-250 |
|
6,265 |
7,870 |
5,878 |
8,589 |
5,625 |
719 |
-253 |
Figure 2
The result that state aid per WADA decreases as state aid itself increases certainly demonstrates that the use of WADA to assess charter school funding is a mistake. In particular, it means that revenue per WADA should not form the basis of comparisons between funding for charters and regular school districts. Such comparisons are inaccurate and misleading.
The estimated Charter surplus of $719 in M&O revenues, relative to ISDs, certainly suggests that Charters have substantial revenues that could be used for facilities.
Figure 3
The practical effect of the current method of determining Charters’ state aid entitlements is that over $700 of M&O revenues per student can be used for facilities and there will still be an amount left for M&O purposes equal to that received by TPSDs, on average.
The website of the Texas Charter School Association contained a notice, dated 06.10.11, that included the following statement:
“On average, charter schools in Texas spend $829 per student from the Foundation School Program (FSP) addressing facility needs.”
If this amount would have grown by as much as four percent annually over the intervening four years, it would now represent a per pupil cost for facility needs of $970. The estimated extra $719 per ADA shown in Table 5, which is the amount that Charters’ M&O revenues exceeded those going to TPSDs during school year 2014-2015, would cover 74 percent of the $970 projected facility costs for Charters. This is a far cry from a “$1,000 gap” that is so frequently expressed by Charter proponents and even their attorneys.
Toenjes may be contacted at ltoenjes@aol.com