A Graphic Look at the State Policy Network
Laurence A. Toenjes
(ltoenjes@aol.com)
The State Policy Network
(SPN) is an enabling organization that promotes the establishment, maintenance
and coordination of what are referred to as “mini Heritage Foundations” in
every state within the U.S. (see the detailed description and references at Sourcewatch)[1].
Sourcewatch describes the cozy relationships between SPN, the Koch brothers,
and the American Legislative Exchange Council (ALEC). As any “Googling” of SPN,
or the references in the Sourcewatch article clearly show, the SPN network has
been much discussed and examined.
Reading about this network is somewhat bewildering due to the number of
member organizations spread across virtually all of the 50 states, and due as
well to the array of causes and issues the various member organizations are
engaged with. The unifying aspect of
the SPN network is the concentrated focus on issues of interest to the right,
including anti-unionism, school choice and privatization of schools, lower
taxes on corporations and the one-percent wealthiest class, and reduced
regulation of economic activities that degrade the environment, among
others.[2]
An important aspect of the
SPN’s support of the network is as a funding coordinator. Although the goal is to establish, fund,
maintain and coordinate conservative issue development activity in every state,
not every state comes up with the wherewithal to fund their in-state
member. There is substantial reliance
on the large, deep-pocketed sources of funds wherever they might be; hence
there is substantial interstate transfer of funds from such major sources to
the various member organizations throughout the U.S. The Searle Tax and Budget
Grant Proposals referred to in footnote [2] describes this process perfectly.
The total annual amount of
funding for SPN and its member organizations has been estimated to be $83
million for the year 2011 (see Sourcewatch article). It is impossible to get a clear picture of the source of all of
these funds since the member organizations, including SPN itself, are 501[c][3]
organizations that are not required to reveal their sources. They are all required to file tax returns
with the IRS (form 990) in which they must state the amounts of their revenues
in various categories, but not where the revenues come from. The 501[c][3] category, however, also
includes non-profit foundations, some of which give money to members of the
State Policy Network. These foundations
must also file the IRS form 990, and although they, also, are not required to
reveal the sources of their funds either, they are required to list the grants
which they distribute to other organizations. Since SPN and its member
organizations receive grants from non-profit foundations, it is therefore
possible to document the amounts and sources of at least part of the monies
that the network members receive. These comprise the data used in this study.
The methodology used to
acquire the amounts of grants from the non-profit foundations going to the
network can be briefly described as follows:
·
The State Policy Network website contained a list of
its member organizations. At the time
their website was accessed for this purpose, 64 members were listed, including
SPN itself.
·
Utilizing Foundation Directory Online (via a basic
level subscription), the name of each organization was submitted. If Foundation
Directory Online’s database contained one or more non-profit organizations that
granted money to the organization being searched for, the year and amount for
each such grant was presented in a spreadsheet type format.
·
One or more such grants were found for 51 of the 64
member organizations listed by SPN on their website. The grants were for the years 2003 to 2013, although the amounts
available for the final two years were obviously incomplete:
o
2003:
$3,954,210
o
2004:
$7,088,162
o
2005:
$5,972,799
o
2006:
$10,382,280
o
2007:
$11,476,082
o
2008:
$11,452,131
o
2009:
$10,754,362
o
2010:
$13,672,292
o
2011:
$13,497,389
o
2012:
$1,802,000
o
2013:
$320,000
o
Total:
$90,371,707
There were a total of 1,901
grants found by the requests. The grant amounts from specific foundations to
specific recipient organizations were summed across all years. When thus aggregated there remained 542
grant linkages from 284 funding organizations to the 52 state policy centers,
including SPN itself. The grand total of all identified grants during this
period was $90,371,707.
Because grants from
non-profit foundations by no means comprise all of the funds received by SPN
and its member organizations, some perspective is needed. As referred to previously, Sourcewatch put
the total receipts by all of the members of the SPN network at $83 million for
the year 2011. This means that the
$13.5 million in grants captured by the methodology used in this study
comprised barely one-sixth of the total funding of the SPN network for that
year. However, the purpose of this undertaking is to demonstrate the extent and
patterns of the substantial movements of funds from granting institutions in
one state that are directed to public policy development centers in other
states. It is argued that sufficient instances
of such financial assistance were captured to make the exercise meaningful and
the graphical depictions of such financial movements representative of the
over-all patterns involved in the funding of the SPN network.
There is one instance when
the entire list of grants to one policy center during one year was
inadvertently released. This was
reported by the Texas
Observer on August 24, 2012.[3] A
link in that article brings up a list of all 129 persons, corporations, and
foundations that together contributed $3,905,658 to the Texas Public Policy
Foundation (TPPF) during the year 2010. The sources used in this study
identified $679,490 of the grants received by TPPF in 2010, just over one-sixth
of the $3.9 million on the grants list obtained by the Observer. Some of the
largest donors to the SPN network identified in this study were on that list,
such as the ED Foundation ($200,495), the Public Welfare Foundation ($175,000),
and the Searle Freedom Trust ($95,000).[4]
The data showing how much
each granting institution remitted to each of the state policy centers allowed
the creation of a network diagram that displays the financial linkages between
all of the organizations. This diagram
(see below) was created with a software program called Netdraw.[5] The data was prepared for use by Netdraw by
another program from Analytic Technologies called UCINET 6.[6] The other type of diagram presented below
consists of a map of the U.S. with the locations of the various funding
organizations and the state policy centers located on it. This map and the
plotting of the points on it was performed by a small program written by the
author, using geographical coordinates to draw the map obtained from the U.S.
Bureau of the Census. The geographical
locations of the organizations were obtained by matching their zip codes with a
file of zip codes and associated geographical coordinates.
Network diagram of State
Policy Network and associated member organizations
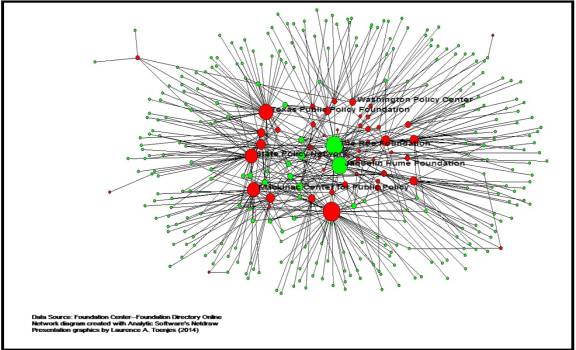
The first example diagram,
Figure 1, is the basic network diagram of the SPN and affiliated member
organizations. The red circles represent the 52 recipient policy centers,
including SPN, and the green circles represent the 284 funding organizations,
identified as described above. The
sizes of the circles, called nodes in network theory parlance, are proportional
to the number of grants received or made, as the case may be. The thin dark lines represent grants from
the green donors to the red recipients. The small green circles with only a
single line to a single policy center make only one grant, to the connected
center. Several of the larger nodes are
labeled, an option while using the software.
Figure 1. Network diagram linking funding
organizations to state policy centers within the State Policy Network framework
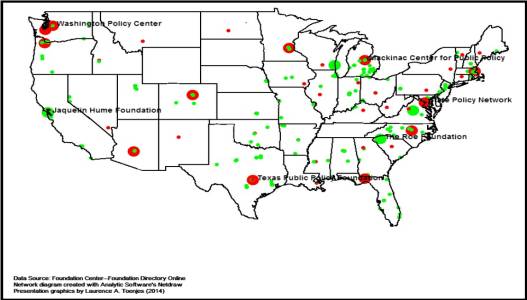
The next diagram, Figure 2,
shows the U.S. map with the policy network organizations located upon it, with
the same ones identified as were identified in Figure 1.
Figure 2. Locations of members of State Policy Network
(red) and their non-profit donors (green)
The following two diagrams
show the same organizations whose names were called out in Figures 1 and 2,
with all of their interconnecting grant linkages highlighted. As can be seen, the grants made and received
by just these six organizations trace out a bewildering maze of
interconnections, crisscrossing the entire country.
Figure 3. SPN network diagram with grant linkages made
or received by six organizations highlighted
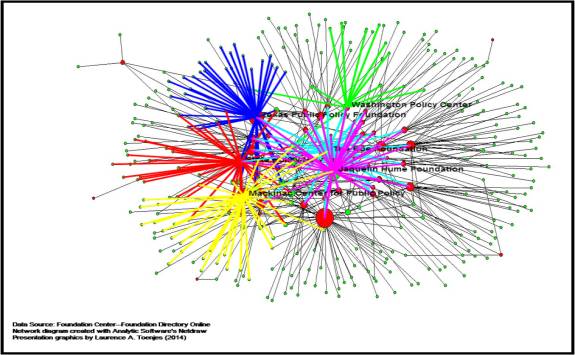
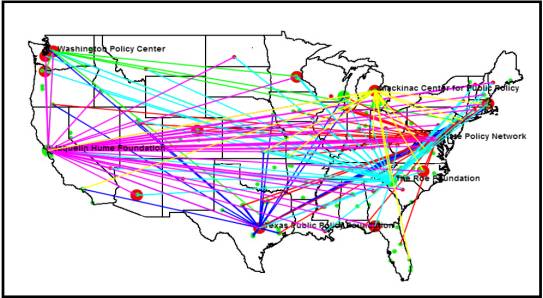
Figure 4. Geographical perspective of same linkages
shown in Figure 3
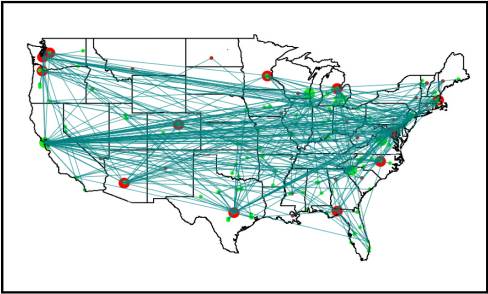
All of the 542 linkages are
depicted in the network diagram in Figure 1 by the thin black lines. The same linkages, representing grants made,
drawn between the same pairs of points but placed on the U.S. map, are shown in
Figure 5.
Figure 5. Linkages between SPN member organizations
and non-profit organizations making grants to them, based on data for years
2003-2012
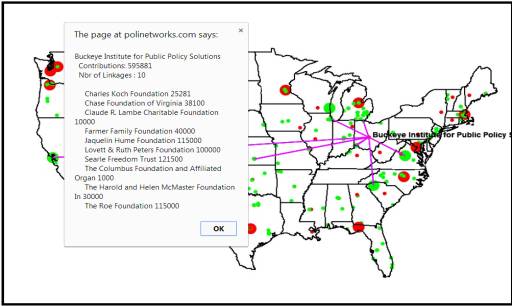
When grant lines made by a
single donor organization, or a recipient policy center, are highlighted it is
also possible to display the total and individual grant amounts, as shown in
Figure 6.
Figure 6. Lines representing grants made to the
Buckeye Institute for Public Policy Solutions and individual grant amounts
Conclusion
The purpose of this paper
was to demonstrate the feasibility of making use of available data on
foundation grants going to state policy centers, to present that data in a
meaningful, diagrammatic form, and to indicate how two different presentations
of the same information—a network diagram and a geographical
representation—each provide an interesting and an informative perspective. Used together, they can give a more complete
understanding of the interrelationships between the two types of organizations,
donors and recipients. Either view can provide a framework for verbal
discussions of the network of organizations, and, if available, it is argued,
will make such discussions easier to understand by most readers. The geographical representation of the data
used in this brief study is perhaps most helpful in making the point that the
state policy center funding, while in part coming from in-state sources, is
highly dependent upon major sources from throughout the country. For example, take the case of the Texas
Public Policy Foundation, where a listing of all sources of revenue for the
year 2010 was available. The total
amount for the sources listed was $3.9 million. The 102 donors identifiable as being from within the State of
Texas made grants to the TPPF totaling $1.9 million. The other $2 million came from just 27 out-of-state donors. If
money is influence, then a relatively small number of out-of-state donors,
acting in a coordinated fashion, could have influence far outweighing that of
the more numerous but on average smaller within-state donors to their domestic
policy center.
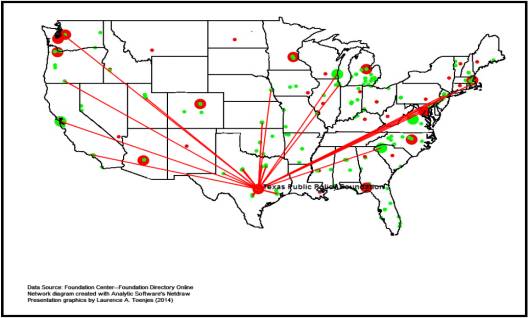
Continuing to use the TPPF
as an example, the last diagram, shown in Figure 7, illustrates the geographical
extent of the out-of-state contributors to the TPPF. The sixteen donors
shown from other states that gave $1.8 million to the TPPF gave another $26
million to policy centers spread throughout the U.S. They include some of the major players in this game, such as the
Charles Koch Foundation, Searle Freedom Trust, Jaquelin Hume Foundation, and
The Lynde and Harry Bradley Foundation, Inc.
Figure 7. Contributors to the Texas Public Policy
Foundation
Residents of Texas might
look at Figure 7 and ask themselves why executives of non-profit foundations in
Washington State, Oregon, California, Utah, Illinois and several other states
feel that it is important to support policy research in Texas? Why, indeed? And
they might also ask why the only grant contained in these data which was made
by ExxonMobil Foundation in Texas went to the Pacific Research Institute for
Public Policy in San Francisco, in the amount of $240,000?
But this gets at the basic
purpose of the interstate policy network—to coordinate policy research in every
state, to draft and promote cookie-cutter legislation designed to further the
goals of those large foundations and small business interests who fund the
entire enterprise. In words taken from
the home page of State Policy Network itself:
“State
Policy Network is made up of free market think tanks - at least one in every
state - fighting to limit government and advance market-friendly public policy
at the state and local levels. SPN and our members make the Founders' vision
for the American Republic a reality as the nation's only 50-state distribution
network for market-oriented public policy ideas. Our programs advance and
defend American liberty and free enterprise by assisting new start-up
organizations, growing existing state think tanks, recruiting talent to the
think tank industry, developing strategic partnerships, and promoting the
free-market state movement.” R
Stir into the network bundles of money from such as the Koch brothers and
the Walton family, with their own self-serving agendas, add in the efforts by
members of the American Legislative Exchange Council to cultivate and propagate
business friendly legislation in every state, make it more difficult for many
citizens to vote, bring together legislators and lobbyists at frequent meetings
and conventions, and you get a pretty toxic mix. Toxic, that is, for an
American Democracy that should be giving at least a little attention to the
other 99 percent.
Notes:
[1] The Sourcewatch link was included in an
article in The Texas Observer, “Revealed: The Corporations and Billionaires
that Fund the Texas Public Policy Foundation”, Forrest Wilder, August 24, 2012,
accessed on May 5, 2014 at http://www.texasobserver.org/revealed-the-corporations-and-billionaires-that-fund-the-texas-public-policy-foundation/
[2] In another article by Forrest Wilder in The
Texas Observer, “The Money Behind the Fight to Undermine Medicaid”, December 5,
2013, at http://www.texasobserver.org/money-behind-fight-undermine-medicaid/
, there was a link to an article that appeared in The Guardian that reported on
the “Searle Tax and Budget Grant Proposals.” This document, described in The
Guardian, was published by the State Policy Network, and is available at https://www.documentcloud.org/documents/842271-spn-budget-proposals-state-by-state.html
. In it are brief summaries of 40
proposed research topics to be funded on a competitive basis by the Searle
Freedom Trust. This document, the
process it describes, and the proposal topics submitted encapsulates the entire
state policy network system, its funding, even the involvement of an editorial
writer with the Wall Street Journal as a grant reviewer. Especially revealing is the range of study
topics proposed by the policy centers responding from 34 states: taxes (mostly reducing them), 9 proposals;
public sector pensions and benefits
(restraining them), 8 proposals; education (supporting private school
tuition), 5 proposals; Medicaid (preventing its expansion, changing to a block
grant program), 4 proposals.
[3] The 8-4-2012 article in
The Texas Observer reported the sum of the donations from 129 “individuals,
corporations and foundations…” totaled $4.7 million. This figure was apparently taken from the TPPF tax return for the
year 2010, which showed $4,674,836 in total revenue. The same document shows “Contributions and grants” of $4,099,459
which still exceeds the $3,905,658 I got when I added the 129 amounts reported.
[4] The list published by
the Texas Observer also showed that SPN itself gave $49,306.90 to the Texas
group, under the name of Ms. Tracie Sharp.
The same name was associated with two other, much larger grants to the
TPPF. One was in the amount of $300,000 from something called the State Think
Tank Fund. The other was for $195,000 from the Government Transparency Fund!
This is doubly ironic, since the only organizations with these names seemed to
be associated with the Open Society Foundation that was established by George
Soros. Whatever the connections, it is
interesting that Ms. Tracie Sharp, who is president of State Policy Network,
has signature authority for such large amounts drawn on organizations that are
not readily identifiable. It is also interesting that SPN did not appear as a
granting institution to any of the 51 organizations for which non-profit
funding sources were searched, yet it appears as a donor to the TPPF in the
inadvertently released list of donors.
[5] Borgatti, S.P., “NetDraw: Graph Visualization Software”, Harvard
Analytic Technologies, 2002.
[6] Borgatti, S.P., M.G.
Everett, and L.C. Freeman, “Ucinet 6 for Windows: Software for Social Network
Analysis”, Harvard Analytic Technologies, 2002.